Section 1
Launch
Launch Course
Share this video to introduce the course. Discuss student takeaways from the video. How is this course similar or different from other courses you have taken in the past?
Note to teacher
Technology Note
Materials Required
Unit 1 Presentation
Data Science Course Introductory Video
Important Messages
Data Talk
Basketball Data Talk
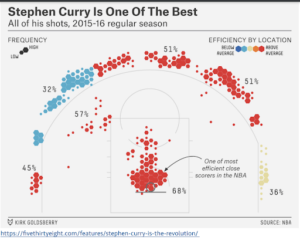
Show the visual below and ask students: What do you notice? What do you wonder? What story can you tell from this visual? View slide (from Unit 1 Slideshow, make your copy above or here)
Discuss
Introduction to Variability
Launch the first discussion about variability by asking questions like, “What are the different factors that are changing in the story? What is the visual telling us about Steph Curry’s shooting?” Students may mention:
- Where Steph Curry takes his shots
- How likely he is to make shots at different locations
- How frequently he shoots from different areas
Say something like, “These represent variability in his basketball shooting. Variability is an aspect of all of life that we can analyze and represent through data science and data visuals. There is variability in anything that changes. For example, there is no variability in the color of my purple mug, it is purple everyday, but there is variation in which mug I pick each morning. That variation is something we could collect data on and represent. It would not be interesting to collect data on the color of my purple mug; it would be purple every day!
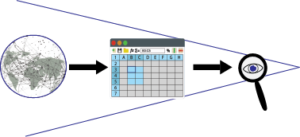
There is all sorts of variability in the world. In data science we collect specific data and then represent that data to tell a story about its variability. This visual representation of the data is the lens through which we view the data. In this graphic, data was collected for a specific year for Steph Curry, but it could have represented data for more than one year. This visual could have represented shots for the whole Warriors team. As data scientists, there are decisions we make about what we will collect and then how we represent the variability.”
Show students the variability visual (Slide). Ask them questions like: “What does this visual communicate to you? How would you relate this visual to Steph Curry’s basketball shooting? How does this visual help you understand the idea of variability and the data science process?”
Variability is everywhere. Ask students, ‘Where do we see variability day to day in our lives?’ Possible examples could be different types of dogs, weather, terrain, hair color, appearance, clothing, height, car make and color…
In data science, we attempt to collect data that represents the variability within the world. After collecting data we build a model or a visual to represent our data. This visual helps others to see the data and tell a story from the data. This is not an objective process and is often influenced by individual bias. We have to make choices about what data we collect and how we will collect the data. We also make decisions about how to model the data or create a visual for the data. This process is creative and may lead to different representations depending on the data scientist.

