Section 8
Data Talk
Pew Data Talk
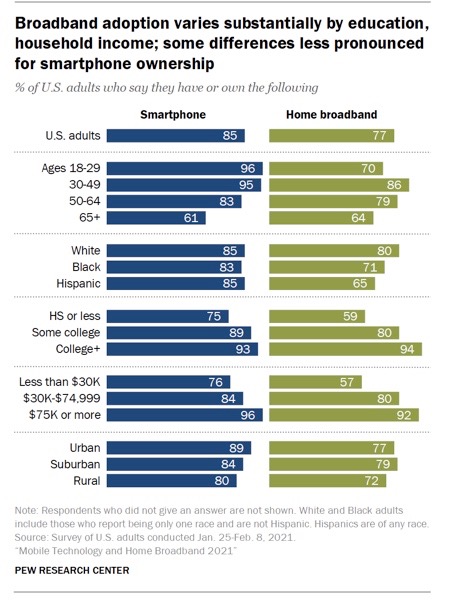
Show students the visual from the Pew data (slide). Give students time to look at the visual. Ask students:
- What do you notice?
- What do you wonder?
- What story does this graph tell?
Have students share their ideas with the class. Ask students what data might have been collected to create this graph? Does this visual raise any data ethics questions for you?
This visual comes from the Pew Research Center. These data are from a phone survey that was collected between January 8 and February 2021. In total, the data represents a sample of 1,502 U.S. adults aged 18+, with 300 answering from a landline and 1,202 answering from their cell phone. Given the context of how the data is collected, does the fact that participants opt into this data collection make it more ethical? How might the fact that this is a phone survey skew the data?
Materials Required
Pew Report Link
Explore
Spreadsheets and Pew Data
Tell students something like: “We are going to be spending more time with the Pew dataset. The same dataset that the visual we discussed in our data talk was drawn from. This dataset has been cleaned and stored in a spreadsheet, which you can see here (download a copy using the link in the Materials Required area below).”
Set students up to look at the spreadsheet in groups. Ask students to discuss the following questions in their groups (Slide):
- What do you notice/wonder about this dataset?
- How is the data organized?
- What does each row represent?
- What does each column represent?
- How do you know this?
- What about the world is this dataset capturing? What variability?
- Are there any ethical questions raised by this data?
Note to teacher
As a class discuss the questions above. Let students know that datasets are often organized in this way where a row of a spreadsheet represents all the responses from one individual and the columns represent all the responses to one question. Have students share the variability they are seeing in the dataset. Use this conversation to continue to build on their understanding of variability. Put up the variability visual (Slide)— how does this relate to the exploration we just engaged in?
Materials Required
Cleaned Pew Data Spreadsheet
Ask Questions
Brainstorm Questions
Show students the Data Science Process Visual (Slide). Let students know that they are going to brainstorm questions they can ask of the data (arrow 1). Set students up in groups to look back at the data and think about what questions they could ask about the data. As students work in groups, you can ask students what they find interesting about the data. What would they want to know more about around these topics? (Slide) For example, are they interested in comparing social media usage across age groups? Are they curious about how many books people read? How books read and internet use are related to each other?
After students have generated a few questions in their groups, invite them to share out as a class. Record students’ questions as they share. (Slide)
Explore
Explore CODAP
Introduce students to CODAP. CODAP is an online tool that allows you to import spreadsheets and explore the data in that spreadsheet. This tool allows you to explore the data by generating graphs of the data. Let students know that they will first have an opportunity to explore and learn about CODAP. Give students a link to CODAP with the data loaded in. Encourage them to play with the software and figure out what it can do, in pairs. Share with them the page of links to resources. There is a video tutorial and additional tutorials available for those who want to use it here. Keep in mind that students learn new technology in all different ways. Some like to dive in and explore and others will want to start with a tutorial. Welcome this variety of approaches. When students are ready they can start trying to answer some of their questions from the brainstorm.
Run a quick class discussion to share CODAP features students discovered and how they think they will be useful.
Materials Required
Pew Data in CODAP
Technology Resources for Unit 1
Explore
Working with CODAP and Pew Data
Share with students the data science process visual. You will be deciding which questions to ask, using CODAP to model the data, synthesizing and analyzing your data, and communicating your findings. Modelling the data will look different in different situations. In this context, visuals of the data will be the models, with CODAP as our tool for creating those visuals.
Set students up in small groups to work on exploring three questions of their choice, in the activity “What Story Does the Data Tell?” (Handout 7). In small groups, students create a poster on a jamboard slide that shares the answers they found, the graphs they used to find them, and a short explanation of why that graph answers the question they had.
Once groups have completed their posters hold a virtual gallery walk where students can visit each other’s posters and leave comments on virtual sticky notes. Students can share on the post-it a question, something they found interesting about the finding, or an insight they gained from the board.
Materials Required
Handout 7: What Story Does the Data Tell?
Pew Data in CODAP
