Have students record notes describing the purpose of a business report, what is included, and what are the features of the writing in their journal or notebook. Refer students to Me and the Bees Business Report Overview for information about what’s coming and the importance of the note taking.
Section 9
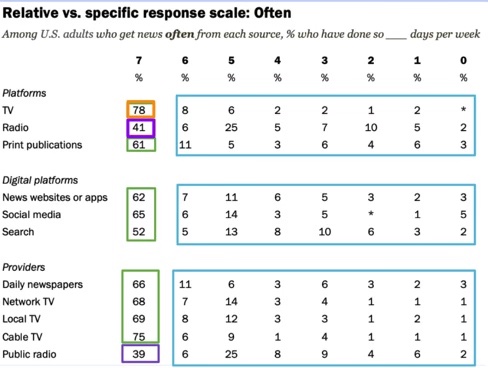
Data Talk
Table Data Talk
Project the data talk visual. Give them some time to look and make sense of it. This might take longer than in other data talks since tables are information-dense. (Slide)
Ask students:
- What do you notice about this table?
- What is it about?
- What do the rows and columns mean?
- What can you say about the data?
Does the color coding and other visuals help? How? (Slide)
Discuss
Intro to Me & The Bees Analysis
Share with students that the data science process is used in all fields of study. The concepts and tools you learn in this course can be applied to any content area you study. Throughout the course we will be looking at data in a variety of contexts and fields of study: community, environment, music preferences, media images, and more. We also learn a variety of data modeling tools and share data analysis in multiple communication styles. In the first project you were analyzing your personal data creatively and in this project you will analyze how data is used in business to make decisions and communicate your findings in a professional business report.
Ask the class if any of them are business owners or if they know any business owners. Share with them the idea that there is no age requirement to starting and running a business. Share with them the story of Me & the Bees and have them watch the video. (Slide)
Companies like Me & the Bees will have a team in their company or an outside consulting firm analyze their data to give recommendations on how to improve their business. Let students know that they will be creating a business report for Me & the Bees. They will be given data to explore, model (find patterns within), and analyze. Finally, they will write a report to communicate their findings and describe recommendations for the company to better understand and improve their business.
Me and the Bees Business Report Project Overview (Handout 8,) is a handout that summarizes this project. The next sections of the lesson plan will walk you through the process of the project step by step. You can choose to share the handout with students now or at any point during the project to give them an overview of the project. Let them know however that you will walk through the sections of the project as a class. When you share the project overview you can also share the project criteria.
Invite students to brainstorm what data a company like Me & the Bees would collect and what the purposes would be. Highlight for students, this is like the step Ask Questions from the Data Science Process. (Show Data Science Process Slide)
Materials Required
Me & The Bees Video
Handout 8: Me and the Bees Business Report Project Overview
Handout 8 Criteria and Feedback Rubric
Explore
Business Report Writing Brainstorm
Let students know that before they dive into the Me and the Bees data, they will take a look at a sample business report from an analysis of recycling trends. This will help them get a sense of what might be included in a business report.
Set students up in groups to look at the business report. Give students a few minutes to read, take notes and annotate the report. Let them know that after reading they will discuss the following (Slide):
- What does this business report include?
- What are the features of the writing?
It is important to remember that this is not meant to be an exact model of what students will be writing when they write their own business report in the next sections. What is important are some of the key features of the writings. Such as: concise, clear, visuals, color, graphs and tables as supporting evidence, bullet points, headings, etc.
Note to teacherIn the ELA writing standards this is called explanatory writing. Consider sharing this project with one of your ELA colleagues. They may have ideas about how to support students with the writing in this project.
Materials Required
Sample Business Report
Handout 8: Me and the Bees Business Report Overview
Explore
Spreadsheet Exploration
Let students know that before they begin working with the data (cleaning, modeling, finding patterns, and analyzing) we want them to have an opportunity to explore the data and understand how it is organized in a spreadsheet. Understanding this visual organization will be helpful as we move later in this course into situations where we can’t see the data as we work with larger datasets in other programs like Google Colab.
Distribute the Me & The Bees sample spreadsheets to the class. Have students spend some time looking at the Me & the Bees sample spreadsheets in pairs, and answering the following questions in their journals (Slide):
- What is the spreadsheet about?
- What does each row represent?
- What about each column?
- Brainstorm some things you could learn about the Me & The Bees business from the data in the spreadsheet.
- What are some questions you still have about it?
- What are additional things about the business you want to know?
Note to teacherIn the spreadsheet students will notice that the days are not in order and that the price of the lemonade is less on Fridays. Taking these factors into account, students can work on cleaning the data and making sense of the spreadsheet. Also, another note is this example data is what sales could have looked like for a single store in Austin, Texas in 2020.
Materials Required
Me & The Bees Sample Sales Spreadsheet
Explore
Cleaning the Data
Share with students that sometimes, like in this case, we have to clean the data first in order to facilitate working with it. We will be doing that here because we have multiple spreadsheets that we want to look at as a single dataset. Cleaning the data is included as part of Gathering Data in the Data Science Process.
Ask students to discuss in groups the steps they would need to take to merge the data into one spreadsheet. Create a class brainstorm. (Slide) Some examples of what students will say is to add rows so that all the months are on one page, add columns to that spreadsheet adding the temperature and city, etc. Ask them what will be important to consider as they do this. (Keeping rows and columns aligned with dates matched up so that data doesn’t end up in the wrong location.)
Before students begin, let them know that an important part of data cleaning is to keep the original data as is. Ask students why this might be the case. Students will likely highlight that we may want to go back and look at the original data in case we made a mistake or think we missed something along the way. In order to do this ask students to create a new spreadsheet where they can copy in data. This way the original data will be available to reference if needed.
In small groups, share the video about merging the data. Then have students work on merging the three months of data into a single spreadsheet and also joining this dataset with the temperature dataset for the store location. (Slide) For this project, we recommend two computers per group, so each pair of students has a computer to look at. Each member of a group should be working in the same spreadsheet as the rest of their group members (Each group has their own spreadsheet). Encourage students to share how they are doing tasks with each other as they work, to ensure that every group member understands how to work in the spreadsheet.
As you are circulating, notice if there are data moves that groups are struggling with. Encourage students to check in with all their group members before asking you questions. There is likely one person in their group that will know how to do the necessary actions in the spreadsheet such as selecting cells, copying, pasting, etc. Encourage students to record notes on their data cleaning moves in their journal or notebook.
After students have merged the data into one spreadsheet have a discussion with the class. What kinds of moves did they use to clean the dataset? What are they helpful for? What do we have to be careful about as we do this work? (e.g. sorting in the same order when adding a column so it matches when you copy it over) Are there ways we can check that we didn’t make mistakes? (Slide)
Materials Required
Cleaning Data in Google Sheets Video
Me & The Bees Sample Sales Spreadsheet
Discuss
Working with a Spreadsheet to Answer Questions
Remind students that they will be writing a business report for Me and the Bees that analyzes the data and gives insight and recommendations about Lemonade sales based on the variables given. This report will reveal your findings: including visuals, analysis, and recommendations for the company on how to increase their sales.
Let students know that in this section they will be working on Modeling the data (Data Science Process Visual) to find patterns using functions, filters, visuals and color coding. Tell them about the Spreadsheet Modeling Tool Guide they will create as a class which will be a tool they can use on this project and future projects. Let them know that they will work in groups on one of the spreadsheet modeling tools to make sense of how it works to teach it to the other groups. Highlight that each group will present on what they learn. (Slide)
Spreadsheet Modeling Tools:
- Add a new column to calculate the revenue for each day.
- Use conditional formatting to color code a column of your choice.
- Sort the data in a different order to get a new perspective on it (for example: by day of the week or temperature rather than date).
- Filter the data to only see that subset and answer your question.
- Summary statistics functions: MIN, MAX, MEAN, MEDIAN, MODE.
- Make a graph comparing two variables of your choice.
Assign each group one of the spreadsheet modeling tools. Set students up to work on their assigned task to figure out how to use the modeling tool, analyze what they learn from the information and then teach the class. Ask them to be prepared to explain to the class. Distribute the handout Modeling Data with Spreadsheets. Create a class copy of Spreadsheet Modeling Tools Guide Slideshow and share with students. Add the link for the class copy to the handout.
Note to teacherSince some tasks are more work-intensive than others, if a group finishes with their assigned task early, encourage them to try others, or come up with their own.
As students are working together, encourage them to talk with each other and explain what they are doing as they are working in the spreadsheet. If students are struggling with how to do one of their tasks, encourage them to look up the topic and see if there are any helpful tutorials to reference. Many times when we are working with new technology in this course and elsewhere we may struggle with how to do something. Searching on the internet for more information is something that data scientists do as well. This will be a valuable approach to become comfortable with throughout this course and beyond. We have optional video tutorials for working with Google Sheets. They are linked with each task on the handout Modeling Data with Spreadsheets or can be found here.
Once all groups have had an opportunity to figure out how to do their modeling tool, analyze their findings, and decide how they will present it, have groups present to the class. Give the rest of the class time to try the modeling tool after each group has presented. Have the group walk around the class and respond to questions that come up as students are trying the tool. By the end, each group should have worked on each of these tasks in their own spreadsheets.
After each group has presented. Highlight for students that everything that was presented on the spreadsheet modeling strategies will be accessible as a resource for them when they work with their partner to write their business report for Me and the Bees. Give groups time to make any final changes to the slideshow.
Materials Required
Handout 9: Modeling Data with Spreadsheets
Spreadsheet Modeling Tools Guide Slideshow
Technology Resources for Unit 1
Analyze
Writing a Business Report
Share the Data Science Process visual with students. Let students know that in this process, they have been asking questions of the data, organizing data, and using visuals and functions to model the data. They have also begun to analyze their findings. They will continue the work of modeling the data, analyzing and synthesizing their findings, and finally communicating their findings in the next part of this project.
For this final activity in this project, divide groups into two pairs. Students will be working in these pairs to write a business report for Me and the Bees. Give them the activity ‘Me and the Bees Business Report’ (Handout 10) and criteria. In this activity, students will use the tools and strategies they learned for working in a spreadsheet, continuing to look for patterns in the data. Encourage students to keep a record of their visuals and findings. Students will then write up a business report based on what they learned from the data, sharing both findings and recommendations. Note: pairs will need to make a copy of their group spreadsheet to continue their modeling in pairs.
As pairs are working, students are welcome to reach out to the other pair in their group to discuss, ask questions and share findings. Encourage students to include the features of the business report they looked at earlier in the unit: concise, clear, visuals, color, graphs as supporting evidence, bullet points, headings, etc.
After students have completed their report, give students time to complete the self-assessment portion of the Me and the Bees (Unit 1): Criteria and Feedback Rubric.
Materials Required
Handout 10: Me & The Bees Business Report
Handout 8 Criteria and Feedback Rubric
Summarize
Portfolio
Give students an opportunity to add their work from this unit to their portfolio in Google Slides. They will add one or two slides for Unit 1 that contain links to their slides from the unit and their individual reflection on the data science process. Invite students to be creative and include visuals on the slides that capture their learning from the unit.
In addition, students can link the Concept Organizer document into their Unit 1 slides.
Note to teacher The Mathematical Mindset Practices Rubric is an opportunity for students to reflect on their mindset including their beliefs about themselves and learning. Consider having students add their reflections to their portfolio. We recommend you have students reflect on the mindset practices throughout the course at the end of units 1, 4, and 8.
Materials Required
Student Portfolio
Student Concept Organizer
Mathematical Mindset Practices Rubric